pScore Reports
Here it is! This is your official handbook for understanding pScore Reports. While each pScore itself provides some general insight, we hope this guide will go a little deeper into what each element of the pScore Report means and how you can put each aspect to work. Read on!
The Date
Every report starts by identifying the target date. This report’s date is December 26th. For reasons we’ll discuss later, it’s important to select the first date of any promotions you’re running when ordering your pScore Report.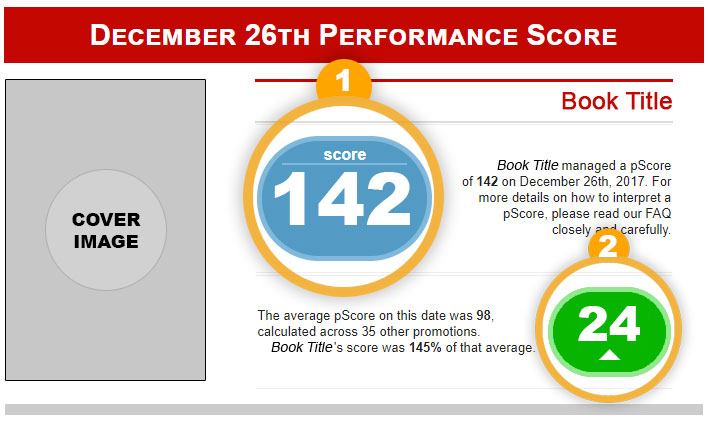
1. This is your Performance Score, or pScore. It is represented by a whole number greater than zero and is calculated by weighing dozens of individual metrics that are tracked over an extended period for multiple books. pScore ranges differ daily by design. It’s a measure of performance compared to other promotions. So if your book had a lower pScore on one date than another, even though the date with the lower score had more sales, it simply means that other promotions on the date with the lower performance had a higher average performance. With this knowledge in hand, you can look at how to better compete with those other books, improve your conversions, and gather even more sales on your next promotion!
2. Speaking of how well your promotion did versus others, your pScore report includes this handy indicator showing the number of points above or below average. Green is good! Red is…not so good. If your book is below average, consider expanding the channels you use to promote your sales, or switch to some alternate channels. Improving your score may also require some investment into your advertising, either by placing online ads with marketing services or growing your social community.
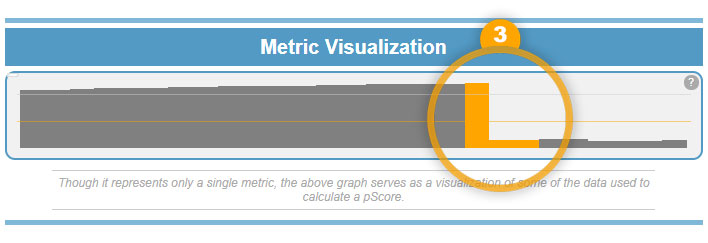
3. This graph shows a single metric for measuring a pScore. It’s based on Amazon’s rank for your book. Our data shows that ranks jump when promotions begin. If the big jump on this graph isn’t orange, then you’ve not properly scheduled your pScore Report, and your score may not be a good indicator of how your promotion really went. It’s important to set your pScore report to run for the first day of your promotion so that we properly track this bump in rank and can align it with the other metrics we track.
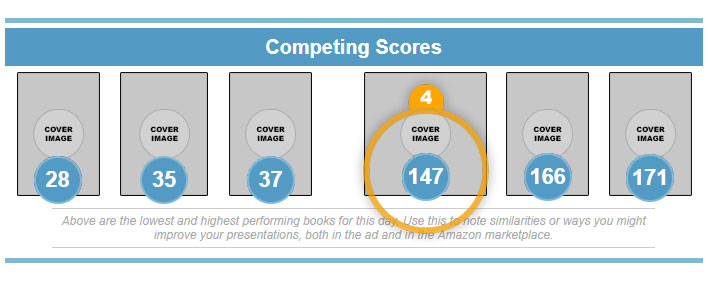
4. Knowing how other books did is a critical component of a pScore Report. In fact, it’s why the pScore was created. Comparing your book’s appeal to the appeal of the books which performed better and worse than yours (if there are any) will help you to improve how your book strikes potential buyers. It’s the first step in improving conversion!
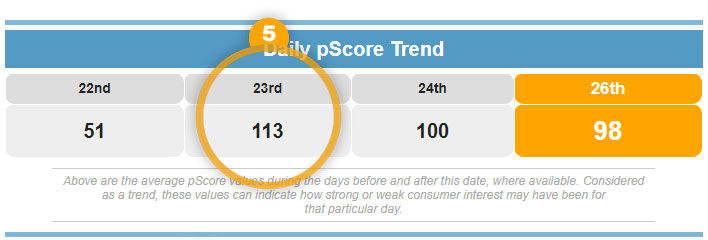
5. As mentioned earlier, pScores can vary widely from day to day. This can mean that one day is better for promoting than others. Compared to four other nearby days, the 26th worked well for this book. If it had been promoted on the 22nd, sales may have been stale because of low buyer interaction. On the other hand, sales may also have been better for this book since competition may have been lower on the 22nd than it was on the 26th. Before making rush judgments about this metric, it’s important to look at the rest of the data. As pScore tracking becomes more advanced, these reports will do a better job of indicating whether or not your book should run on a Tuesday or a Friday or the first week of the month or the last week of the month, for example.
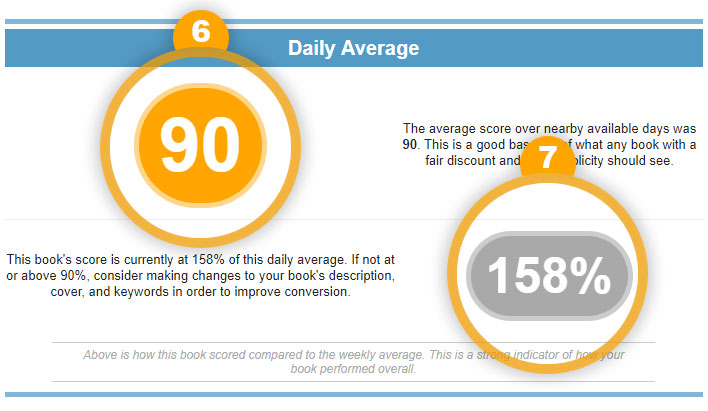
6. Daily averages look at the trends above and provide a picture of the week as a whole. In the future, recommendations on when you should run your promotions will be available, and data will improve on many other metrics that can then be added into the pScore reporting system. Our goal is to fine tune your book’s promotional plans as precisely as possible, using real data and performance to light the way.
7. If your book is performing above the daily average, you’re doing just fine. It means your book competes well across all metrics, and you could probably improve sales by simply investing into more advertising. Still, wouldn’t you like to see this number go up? So would we. And we’re working on adding more metrics to extend your lead over the competition.
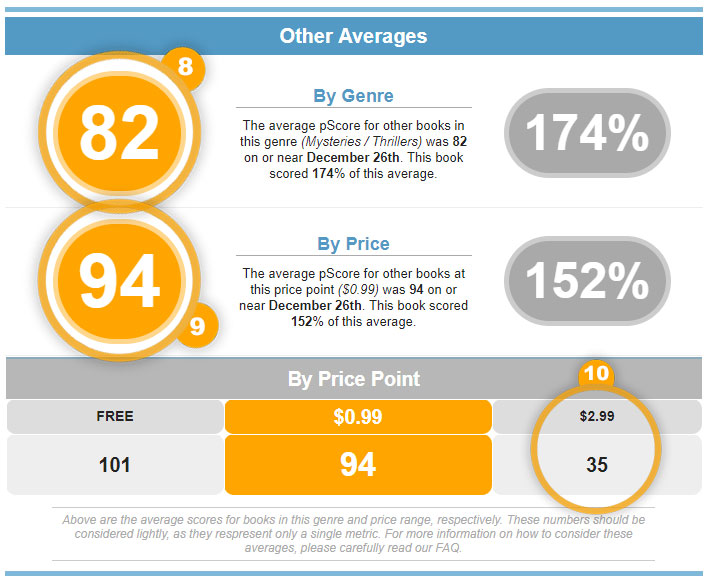
8. Other averages are important, too! These may actually help you most when you’re first starting with measuring performance. Knowing the average performance by genre can tell you if the channels you’re using to promote your book are any good for your book’s genre. Or perhaps your book would perform better if listed in another genre. Should you try Suspense rather than Thrillers? This metric can lift the veil!
9. Knowing the average score by price doesn’t hurt, either. If your 99¢ book under-performed, then you know buyers don’t see it as an attractive deal. Maybe it should be free? Sometimes, we have to follow buyer feedback and convert paid books into free books, thinking of them more as a way to advertise ourselves as authors than a way to generate direct revenue.
10. What if the reverse is true? While $2.99 books performed poorly on this date, free books and 99¢ books performed similarly! If your book was free, you may have had the same level of performance by making it 99¢ instead, helping recover some ad fees. But don’t be fooled. Many free books are always free, and this can give a false picture of results. It’s why free books are the hardest to track, and it’s why retailers are so finicky about whether or not affiliates can promote these items. If you see similar scores here, consider running another promotion at a different price point to get a better picture of what’s happening.
We hope this gives you a better idea of how pScores can help you promote your books. If you need more information, please let us know. We’re working on video workshops to accompany your pScore Report that will go over each section in detail. In the meantime, let us know how you’ve applied what you’re learning from pScores to help improve your promotions.